
S&P 500 earnings are exceeding elevated expectations. Before earnings season began, S&P 500 earnings were expected to grow 23.6% as businesses rallied from lower earnings during the COVID shutdowns from one year ago. Based on the first quarter of companies reporting, earnings are now expected to grow more than 33.8%, and revenue is now expected to rise 7.5%.
Key Points for the Week
- S&P 500 earnings are expected to grow more than 30% because companies are beating earnings estimates by a wide margin. Revenue growth is also well ahead of expectations.
- Improved retail sales aren’t just taking place in the U.S. Last month, loosened COVID restrictions and increased use of online shopping pushed retail sales up 5.4% in the United Kingdom.
- Housing prices continue to trend higher. The median price of existing homes rose 17.2% from last year as builders wrestle with shortages in land, labor and materials.
Consumers taking advantage of increased freedom to buy goods isn’t limited to the U.S. U.K. retail sales gained 5.4% compared to last month. Gains in online sales and the home improvement sector supported the growth.
U.S housing markets continue to rally. Existing home prices rose 17.2% from last year (Figure 1). Lumber prices have gained more than 300% since the pandemic began as Americans look to increase the comfort of their homes by remodeling or moving to larger homes further removed from city centers.
Stocks were largely flat last week. The S&P 500 and the MSCI ACWI both dipped 0.1%. The Bloomberg BarCap Aggregate Bond Index gained 0.1%.
This week, the government reports first quarter GDP as well as inflation and consumption data through the first quarter. The Federal Reserve also meets as investors start to look for clues on how the Fed will approach interest rates and short-term spikes in inflation.
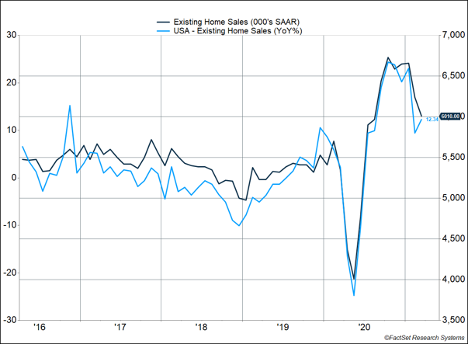
Figure 1
Building a Bubble?
Is the housing market in a bubble? It turns out this question is on many people’s minds. In the past month the number of Google searches asking “When is the housing market going to crash?” rose 2,450%. Why do some investors believe the housing market might be forming a bubble? The biggest reasons are prices have increased significantly and houses are selling quickly.
The median price of an existing sold home reached $329,000 recently, the highest on record and a 17.2% rise from March of last year. Prices for the key inputs to building a new home have also moved higher. Prices for land, labor and lumber (and other materials) have moved significantly higher. Lumber prices have increased 300% since the pandemic began and have added $24,000 to the average price of a new home.
Houses are flying off the market. The average time to sell is 18 days, and half of homes sell in a week, often at prices above the listing. Competition for houses is fierce because of a lack of supply. As shown in Figure 1, existing home sales have dropped from above 6.5 million per month to just above 6 million. There are 28% fewer homes for sale compared to last year. Based on purchase rates, that is only 2.1 months’ supply. New homes show similar dynamics. Single-family home starts rose 15.3% in just one month. Inventory only covers 3.6 months of demand.
The evidence warrants further attention to the housing market. Rather than a bubble, a number of factors have pushed housing prices up. COVID has forced a reassessment of living arrangements for many while reducing the number of people willing to sell their homes. Who wants to invite a hundred strangers over to traipse through your home during a pandemic? COVID has also made the risks of moving to a retirement community or a nursing home higher. Foreclosures have slowed as government programs have made it easier to stay in your house while stimulus checks help pay the mortgage.
The limited supply is meeting strong demand. Many are anxious to get out of cities. Low interest rates plus a pandemic make having a second home more attractive. Stimulus checks boosted remodeling efforts as other large-expense items, like vacations, were inhibited by COVID. Remodeling existing homes drives up the price of lumber as more families add extra space for a playroom or home office.
Tougher mortgage standards are another reason a bubble seems less likely. Unlike during the housing bubble, banks have held to tougher lending standards, meaning more homeowners should be able to pay their mortgage off over time.
Rather than forming a bubble, it is likely prices have adjusted rapidly to reflect the new market environment. The great thing about markets is participants don’t stand still. Some demand will respond to higher prices and delay moving. New home construction will likely pick up, and additional mobility will slow the remodeling pace. Building materials will become more readily available. Like the witches in Macbeth’s chant, finding a house may require double, double toil and trouble, but we don’t see the housing market heading to a bubble.
—
This newsletter was written and produced by CWM, LLC. Content in this material is for general information only and not intended to provide specific advice or recommendations for any individual. All performance referenced is historical and is no guarantee of future results. All indices are unmanaged and may not be invested into directly. The views stated in this letter are not necessarily the opinion of any other named entity and should not be construed directly or indirectly as an offer to buy or sell any securities mentioned herein. Due to volatility within the markets mentioned, opinions are subject to change without notice. Information is based on sources believed to be reliable; however, their accuracy or completeness cannot be guaranteed. Past performance does not guarantee future results.
S&P 500 INDEX
The Standard & Poor’s 500 Index is a capitalization-weighted index of 500 stocks designed to measure performance of the broad domestic economy through changes in the aggregate market value of 500 stocks representing all major industries.
MSCI ACWI INDEX
The MSCI ACWI captures large- and mid-cap representation across 23 developed markets (DM) and 23 emerging markets (EM) countries*. With 2,480 constituents, the index covers approximately 85% of the global investable equity opportunity set.
Bloomberg U.S. Aggregate Bond Index
The Bloomberg U.S. Aggregate Bond Index is an index of the U.S. investment-grade fixed-rate bond market, including both government and corporate bonds.
https://www.cnbc.com/2021/04/13/when-is-the-housing-market-going-to-crash-consumers-ask.html
https://www.nytimes.com/2021/02/26/upshot/where-have-all-the-houses-gone.html
https://insight.factset.com/sp-500-earnings-season-update-april-23-2021
https://www.nar.realtor/newsroom/housing-market-reaches-record-high-home-price-and-gains-in-march
https://www.census.gov/construction/nrc/pdf/newresconst.pdf
http://shakespeare.mit.edu/macbeth/macbeth.4.1.html
Compliance Case # 01016896
